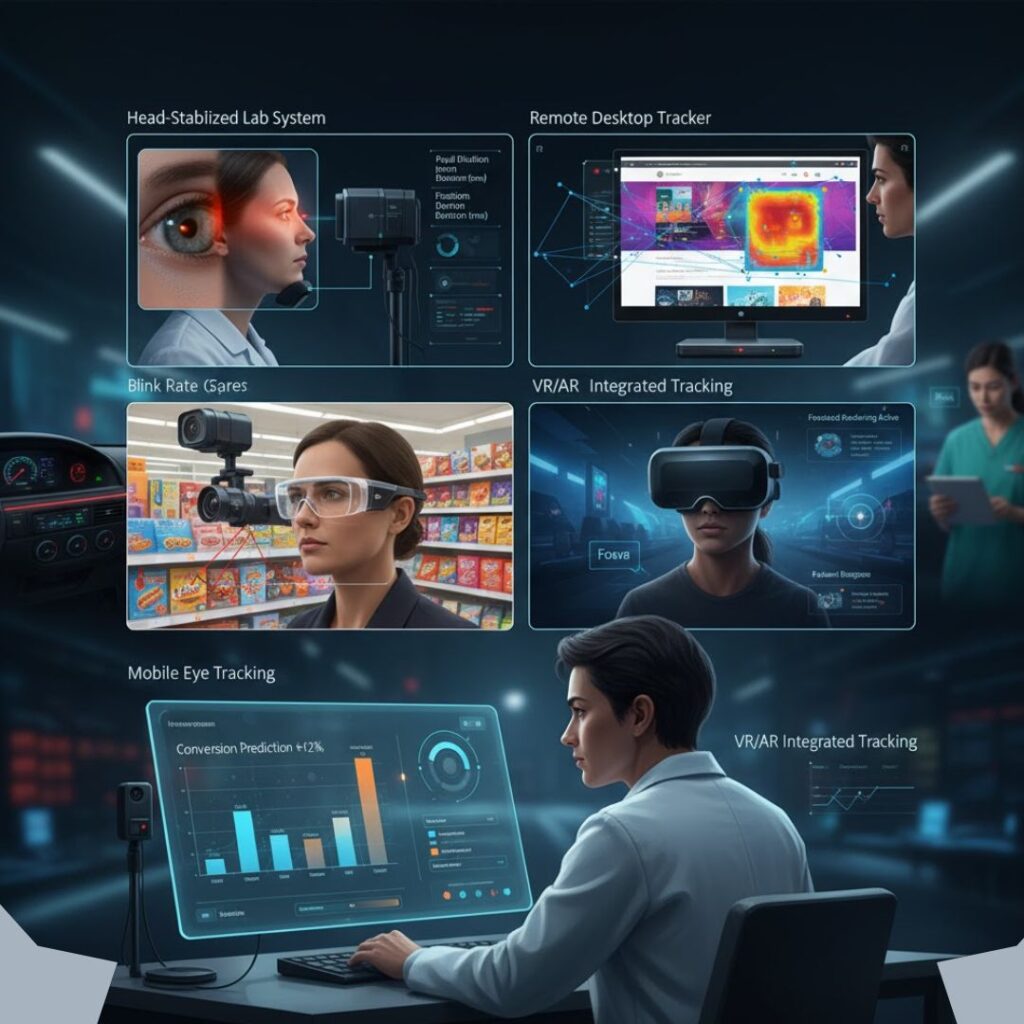
Market researchers are experts at understanding the consumer mind. Through surveys, focus groups, and interviews, we gather invaluable data on what people think and say about a product, brand, or advertisement. But what about the things they can’t tell us? What about the subconscious, split-second decisions that drive their attention and influence their choices?
This is where eye tracking comes in. It’s a powerful technology that reveals what consumers actually see, filling the gap between what they report and what they subconsciously experience. Integrating it into your workflow isn’t about replacing your current methods; it’s about adding a powerful new layer of objective, visual data to make your insights even stronger. Here’s a simple workflow to get you started.
Step 1: Start with a Clear Research Question
Before you begin any test, you need to know what you’re trying to learn. A well-defined question will guide your entire study and ensure you get actionable results. Don’t just ask, “What do people think of our website?” Instead, ask something specific, like:
- “Which of these three package designs captures the most attention on a crowded digital shelf?”
- “In our 15-second video ad, do viewers notice the brand logo and the call-to-action?”
- “On our product page, are users seeing the shipping information before adding an item to their cart?”

Step 2: Design the Study and Prepare Your Stimuli
Your “stimuli” are the visuals you’ll be testing. This could be anything from website mockups and ad creatives to images of product packaging or planograms. Ensure your stimuli are high-quality and accurately represent what you want to test. Then, decide on the parameters of your study. How long will each image be shown? In what order will users see the designs? A thoughtful setup combined with the right eye tracking tool is key to getting clean and reliable data.
Step 3: Recruit Your Target Audience
The power of your insights depends on the quality of your participants. Make sure you are testing with people who represent your actual target demographic. One of the biggest advantages of modern AI eye tracking tools is the ease of remote testing. You can recruit participants from anywhere in the world and have them complete the study from the comfort of their own homes using their webcams.
Step 4: Run the Session and Gather Visual Data
This is where the magic happens. As participants view your stimuli, the eye-tracking software works seamlessly in the background, capturing their gaze patterns. The process is non-intrusive and allows for the collection of unbiased, natural viewing behavior. You’re not just asking them what they saw; you’re measuring it directly.
Step 5: Analyze the Heatmaps and Gaze Plots
Once the sessions are complete, you can dive into the visual data. The results are often presented in a few intuitive formats:
- Heatmaps: These aggregate data from all participants to show you the “hotspots” of visual attention. You can instantly see which parts of your design were seen the most.
- Gaze Plots: These trace the path of individual or collective eye movements, showing you the order in which elements were viewed.
- Areas of Interest (AOIs): You can draw boxes around specific elements (like a logo or price tag) to get hard data on how many people saw them, how quickly, and for how long.
Step 6: Combine Visual Data with Traditional Methods
This step is where you truly integrate eye tracking into your workflow. Compare the visual data with your other research findings. For example, you might use the eye tracking ai data to understand why survey respondents preferred Design A over Design B. Perhaps the heatmap shows they spent significantly more time looking at the key value proposition on Design A. This combination of “what they saw” and “what they said” creates a much richer, more complete story.
Step 7: Create an Actionable, Insight-Driven Report
The final step is to translate your findings into a clear, actionable report. Go beyond simply presenting the data. Use the heatmaps and other visuals to tell a compelling story. Conclude with concrete recommendations backed by both qualitative feedback and objective visual evidence.
Conclusion
Integrating an eye tracking tool into your market research process elevates your ability to understand the consumer. It transforms abstract questions about attention into concrete, measurable data points. By layering these powerful visual insights onto your existing research methods, you can gain a more profound understanding of consumer behavior and make smarter, more confident business decisions.
FAQs
1. How does eye tracking complement qualitative research like interviews?
Eye tracking provides objective, quantitative data on what a person saw, which can be used to validate or explore their subjective statements from an interview. If a user says they found a website easy to use, eye-tracking data can confirm this by showing a smooth, logical gaze path, or challenge it by revealing where their eyes darted around in confusion.
2. Can I use eye tracking for A/B testing?
Yes, it’s a perfect tool for A/B testing. While standard A/B tests tell you which version won, eye tracking tells you why. You can see exactly which visual elements in the winning version captured more attention, leading to better performance.
3. How many participants are needed for a reliable eye-tracking study?
The number of participants depends on your research goals. For qualitative insights (understanding “why”), you can often uncover major trends with a smaller sample size of 15-30 participants. For quantitative benchmarking, a larger sample size may be needed.
4. Is remote, webcam-based eye tracking accurate?
Yes. Thanks to advancements in artificial intelligence, modern webcam-based eye tracking is highly accurate and reliable for a vast range of market research applications. A key advantage is that it allows you to test participants in their natural environment, leading to more realistic behavioral data than a traditional lab setting.

